[Runtime
](../../../index.md)[Package Manager
](../../../pm/cli/install/index.md)[Bundler
](../../../bundler/index.md)[Test Runner
](../../../test/index.md)[Guides
](../../index.md)[Reference
](https://bun.com/reference)[Blog
](https://bun.com/blog)[Feedback
](../../../feedback/index.md)
Bun implements V8’s heap snapshot API, which allows you to create snapshots of the heap at runtime. This helps debug memory leaks in your JavaScript/TypeScript application.
![]() snapshot.ts
snapshot.ts
import v8 from "node:v8";

// Creates a heap snapshot file with an auto-generated name
const snapshotPath = v8.writeHeapSnapshot();
console.log(`Heap snapshot written to: ${snapshotPath}`);
[
](#inspect-memory-in-chrome-devtools)
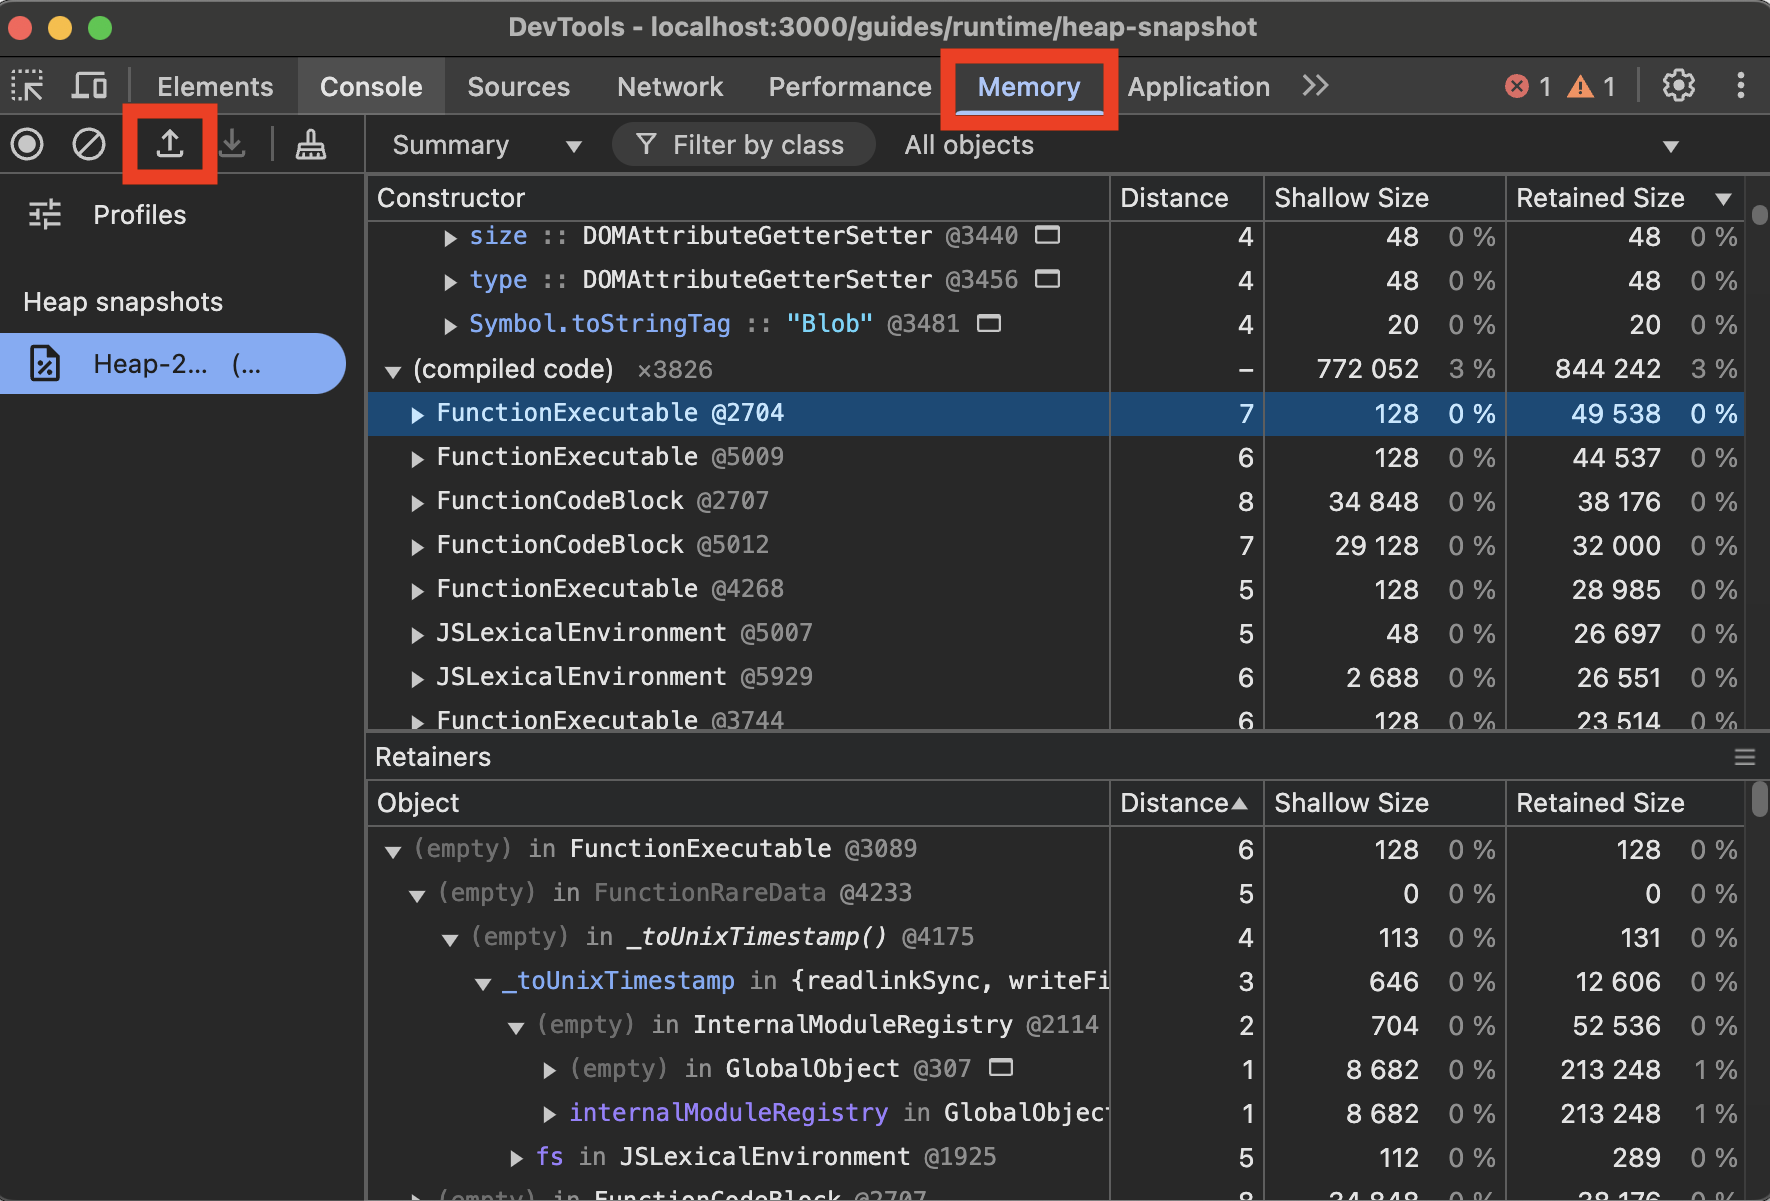
Inspect memory in Chrome DevTools
To view V8 heap snapshots in Chrome DevTools:
- Open Chrome DevTools (F12 or right-click and select “Inspect”)
- Go to the “Memory” tab
- Click the “Load” button (folder icon)
- Select your
.heapsnapshotfile
Was this page helpful?
[
Debugging Bun with the web debugger
Previous
](../web-debugger/index.md)[
Build-time constants with --define
Next
](../build-time-constants/index.md)